- Format-3
- Curiosity
- Perspective
- The Control Layer
The Control Layer


Share article
The asset is not the advantage. Grid-scale batteries have crossed the line from novelty to infrastructure faster than almost anyone forecast. The IEA counted 63 GW of new utility-scale storage in a single year, taking global capacity past 124 GW, while project costs fell roughly 40% to around USD 150/kWh.
In California, storage now sits at close to a quarter of peak load. In the UK and South Australia it’s around 15%. In 2019, all three were under 5%.
When capacity scales that quickly and costs fall that fast, the asset stops being the differentiator. A 100 MW battery in Bavaria is much the same as a 100 MW battery in Burgundy. The cells are commoditising. The EPC market is maturing. And the optimisation algorithms, the models that decide when to charge, when to discharge, and which market to bid into, are converging on a similar frontier of performance, because they’re solving a similar problem with increasingly similar data.
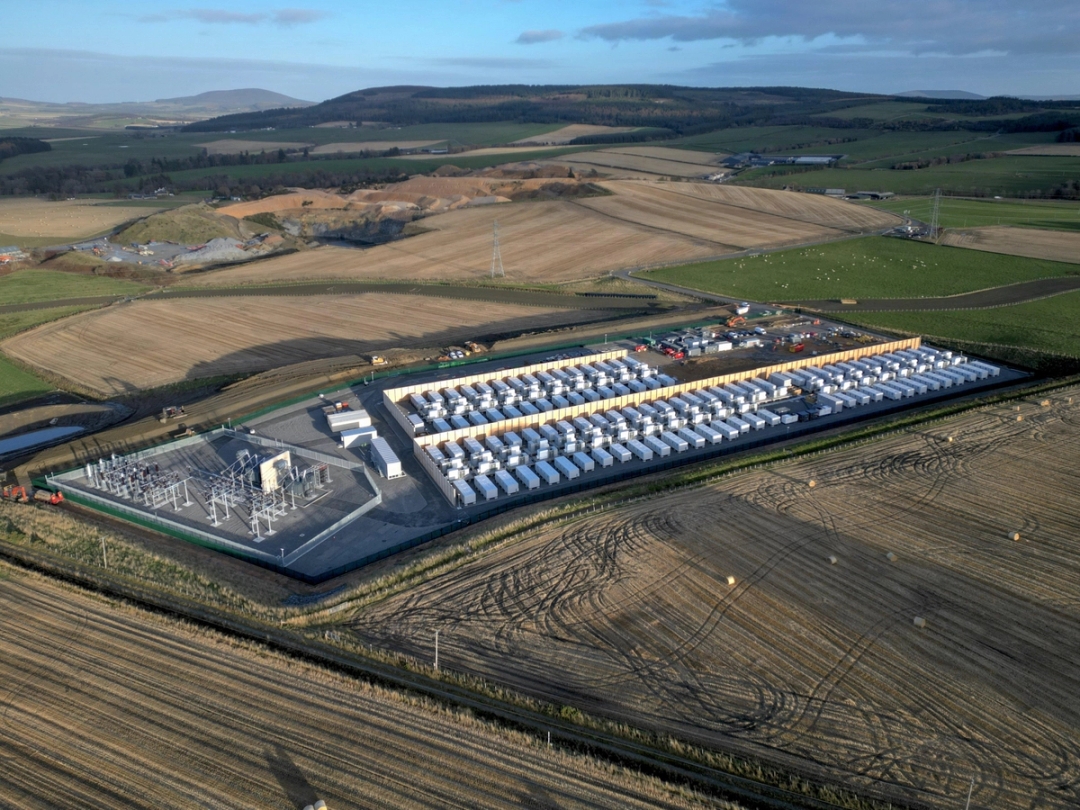
So what does an asset owner actually buy when they hand their battery to an optimiser?
They buy a promise about money they cannot independently verify, made by a system they cannot see, about decisions taken thousands of times a day at intervals shorter than they can observe.
That is an enormous amount of trust to extend. And the only place that trust gets built, tested, and either confirmed or quietly eroded is the interface.
This is why we think portals in this sector are badly misunderstood. They get scoped as reporting layers, a place to put the numbers once the real work is done. In practice they are the product surface for the entire commercial relationship. They are where competence becomes legible, where disputes are pre-empted or created, and where renewal decisions are made long before the renewal conversation happens.
The brief
Alpiq is one of Europe’s more consequential flexibility players: a Swiss energy company with a strategy built around hydro, pumped storage, and a fast-growing battery portfolio spanning Switzerland, France, Germany and wider Europe, with a stated ambition to operate a multi-gigawatt flexibility portfolio by 2030. As that portfolio scaled across multiple market geographies, Alpiq needed a customer-facing portal: a single place where storage asset owners and operators could see commercial and operational performance, plan around maintenance, understand incidents, and reconcile what they were paid. You can see the finished work in our Alpiq Battery Customer Portal case study.
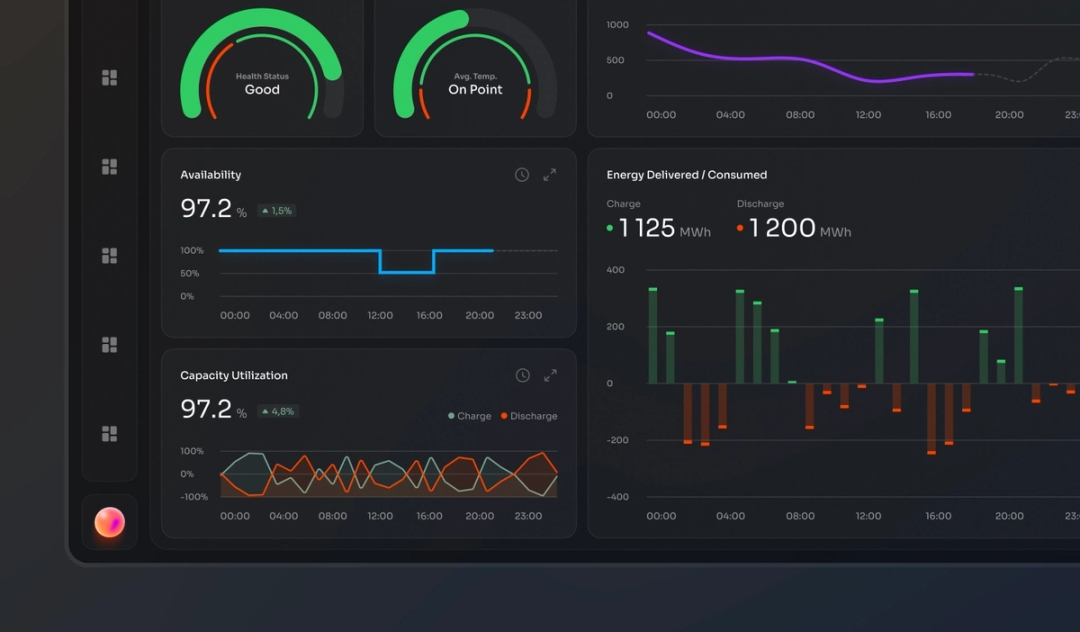
The requirement list read like several different products stacked on top of each other. Dashboards of headline KPIs. High-resolution historical time series across multiple contract types and market products. Maintenance and unavailability planning. Real-time ingestion of fault events from the control algorithms. Monthly settlement, with downloadable statements. Contract records. Support ticketing. Role-based access. Light and dark modes. Desktop through to mobile. Full design system handover to a development team that was building the backend in parallel.
Underneath all of it sat the genuinely hard problem: battery economics are not intuitive, and the data that describes them is dense, multi-rate, partially confidential, and financially consequential. Getting it onto a screen is trivial. Making it mean something, quickly, to someone with money at stake, is the work.
Phase one: reframing before drawing
We did not start with screens. We started by rebuilding the shared model of what the system actually was.
On a project like this the commercial team, the trading desk, the algorithm team and the platform engineers each hold a different mental model of the same object, and each of those models is correct within its own frame. The word “availability” means one thing to an engineer measuring uptime, another to a trader describing what was biddable into a market, and a third to a contract manager assessing whether a guarantee was met. Left unresolved, that ambiguity doesn’t stay in the workshop. It propagates into the data model, into the UI, and eventually into a customer’s inbox as a number they don’t recognise.
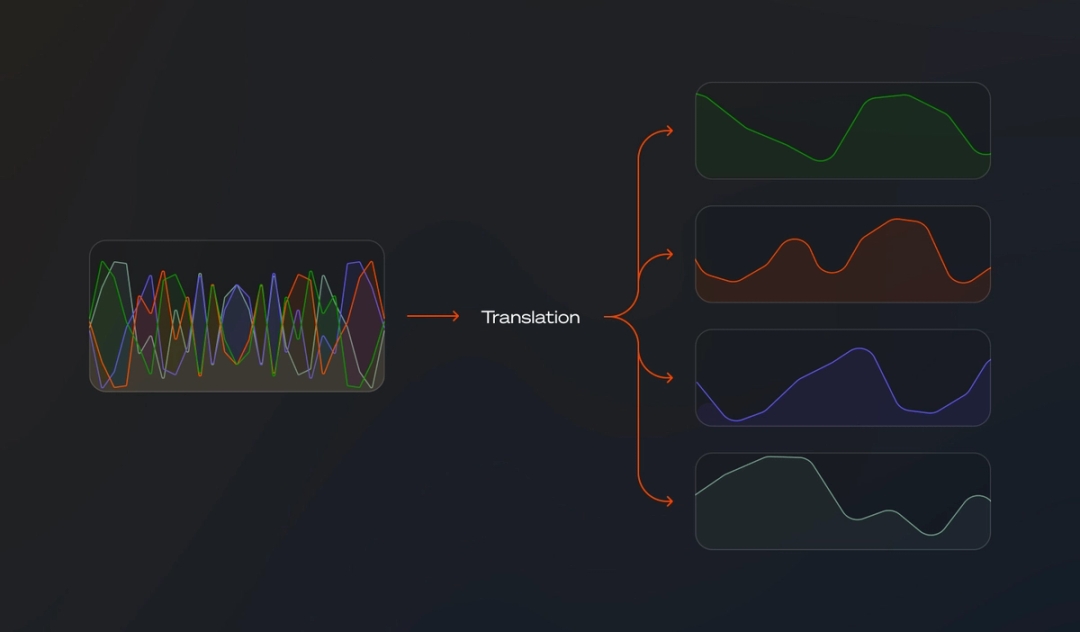
So the first phase of the engagement was translation: taking dense operational and financial complexity and resolving it into a single product foundation that commercial and technical stakeholders could both stand behind. Not a research exercise for its own sake, but a forcing function. Design, done early enough, is the cheapest available mechanism for making an organisation agree on what its own words mean.
The output of that phase wasn’t a wireframe. It was alignment: a shared vocabulary, an agreed information hierarchy, and a clear view of which decisions the portal existed to support. Everything visual followed from it.
Five things that make BESS portals genuinely hard
Anyone who has designed a data-heavy B2B product will recognise some of this. But battery storage has a specific set of problems that don’t appear in the general enterprise-dashboard playbook.
1. The transparency paradox. An optimiser’s dispatch logic and price signals are the product. They cannot be exposed, because that’s the IP, and in some cases exposing it would be commercially reckless. But the asset owner is entitled to complete clarity on volume, availability, performance and revenue. So the portal has to be radically transparent and deliberately opaque at the same time, along a boundary that has to be drawn deliberately rather than by accident.
Getting this wrong in either direction is expensive. Show too much and you give away the model. Show too little and every screen reads as evasion. The design task is to show the shape of the decision without showing the recipe: forecasts expressed in volume rather than price, outcomes explained by their consequences rather than their inputs. Done well, restraint reads as confidence. Done badly, it reads as something to hide.
2. Time is not one thing. A battery lives in at least four time bases simultaneously. There is response time, measured in sub-second frequency regulation. There is market time, measured in settlement intervals. There is operational time, measured in maintenance windows and degradation curves over months. And there is financial time, measured in monthly settlement and multi-year contracts.
Most dashboards pick one of these and force the others to fit. That’s the single most common structural failure we see in this category. The temporal model has to be designed first, as a first-class part of the information architecture, because every other decision inherits from it: chart types, granularity controls, aggregation defaults, and what “now” even means on a given screen.

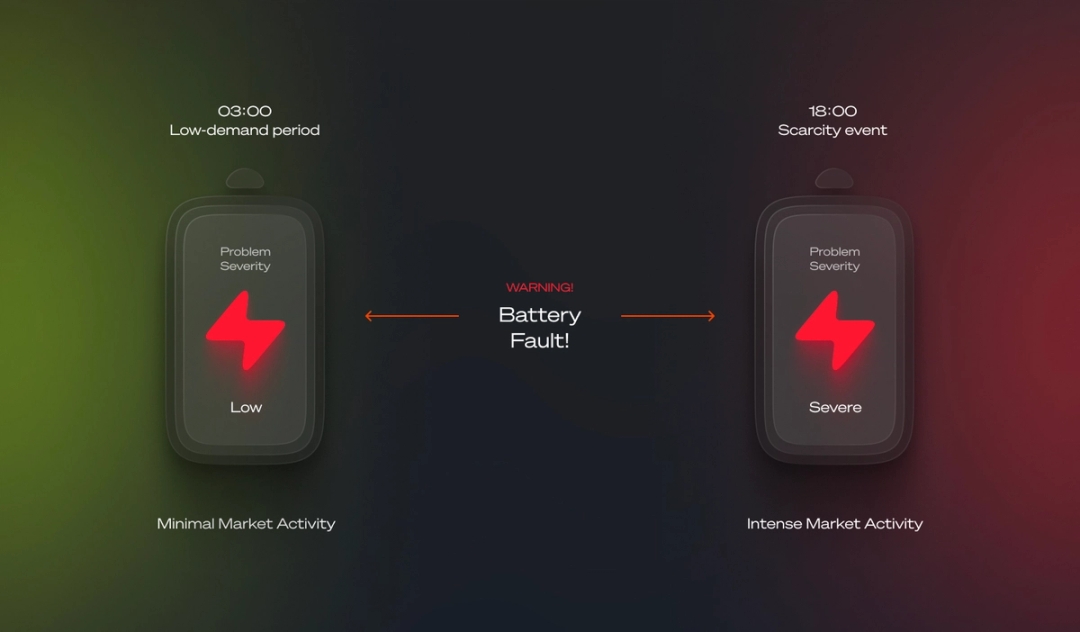
3. Alerts have to be economically indexed, not chronologically sorted. A control-failure event at three in the morning on a low-price Sunday is noise. The identical event during a scarcity hour costs six figures and may breach an availability guarantee. They are the same event technically and entirely different events commercially.
Sorting by recency, the default in almost every monitoring tool ever shipped, actively buries the ones that matter. Building a severity model that reflects financial consequence rather than technical category is a commercial modelling exercise before it is a visual one. The colour system comes last, and it only works because the model underneath it is right.
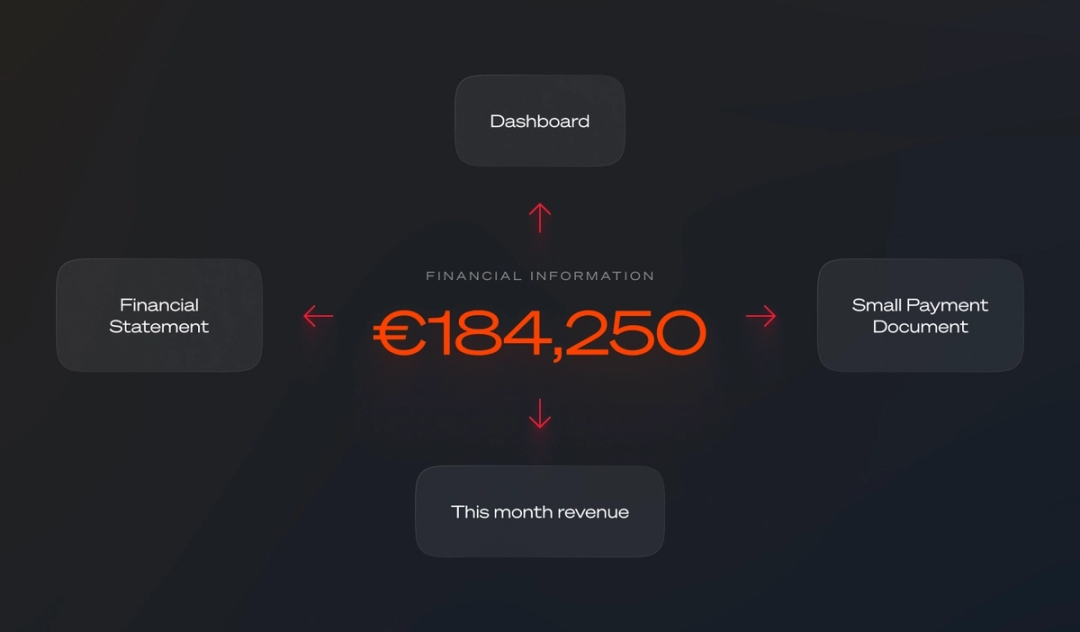
4. Settlement is where trust is won or lost. The dashboard tells the owner what happened. The settlement statement tells them what they’re being paid. If those two ever disagree, or merely appear to disagree because they aggregate differently or round differently or label the same quantity two ways, you have manufactured a support ticket and, more damagingly, a doubt.
Reconciliation has to be a design principle, not a QA step. Every figure on a dashboard should be traceable to a line in a settlement file, and the interface should make that lineage visible rather than asking the user to take it on faith. Portals that treat settlement as a download link tend to generate a steady, corrosive stream of “can you explain this number” emails that no amount of visual polish will stop.
5. You are designing on top of a system that is still being built. The data model, the APIs and the algorithm outputs were all in motion. The honest response to that is not to wait. It’s to accept that the design is the specification, and to produce it with enough precision that engineering can build against it: tokenised components, documented states, explicit empty and error and degraded conditions, and a handover that answers questions before they’re asked.
Working to a compressed timeline, as we were, has an underrated benefit here. It eliminates discovery theatre. There is no time for research that doesn’t change a decision. Every activity has to earn its place by resolving something.

What it produced
The finished portal is structured, scannable and prioritised by importance rather than by data availability. Critical events surface instantly with severity signalling designed for a high-stakes environment. Complexity is made navigable through hierarchy rather than hidden behind it.
In our design testing the reframed interface delivered a 55% reduction in cognitive load, a 35% improvement in readability, and a 2.5x improvement in reaction time to significant events. That last number is the one that matters commercially: in a merchant asset, the gap between noticing something and acting on it is denominated in revenue.
Alpiq’s Head of AI, Zoltán Godó, put it this way:
“The complexity behind our battery operations is significant. Format-3 brought structure and clarity to that complexity, delivering a portal that aligns technical precision with usability.”
What the project ultimately became was not a customer interface. It became an operational control layer: the place where performance becomes clear, decisions become confident, and a portfolio becomes genuinely controllable. The full case study is here.
Where this goes next
Three shifts are already visible, and we think they reshape what energy companies should be building.
The interface becomes the retention mechanism. As optimisation performance converges, the marginal difference between two providers’ spread capture narrows toward the noise floor. What doesn’t converge is whether an owner can see what they’re getting. Legibility becomes the differentiator, because it’s the only part of the offer the customer can directly evaluate. Energy companies that treat the portal as a cost centre will find themselves competing purely on price against companies that treat it as the product.
Portfolios are going heterogeneous, and interfaces have to anticipate it. The flexibility stack is not going to stay batteries-only. It is already batteries plus pumped hydro plus demand response plus EV fleets plus thermal storage, aggregated and co-optimised. An interface architected around “a battery” will need to be rebuilt. An interface architected around a flexible asset with a state, a commitment, a market exposure and a settlement position will absorb the next asset class without a rewrite. Designing for the portfolio you don’t have yet is not speculative. It’s the cheaper path.
Explainability becomes a design surface. Dispatch and forecasting are already model-driven, increasingly AI-driven, and the sophistication is only going one way. As more of the decision moves inside a model, the interface’s job shifts from displaying data to explaining decisions. Not a log of what the algorithm did, but an account of why, including what it declined to do and what that choice was worth.
This is where the next real design frontier sits. The trajectory runs from read-only reporting, to co-pilot, to delegated control. Owners will want to set constraints rather than press buttons, things like risk appetite, cycling limits, availability commitments and revenue floors, and then see clearly and continuously how those constraints played out against the market. Designing that constraint-setting relationship between a human owner and an autonomous optimiser is a hard, unsolved, and extremely valuable problem.
Underneath all three sits a regulatory current running in the same direction. As storage becomes system-critical rather than marginal, auditability stops being a back-office concern and becomes an interface requirement. Numbers will need visible provenance. That is a design problem long before it’s a compliance one.
The argument
Energy companies have historically treated customer interfaces as the last mile, a wrapper around the real engineering. That made sense when the product was a commodity delivered through a physical network and the customer relationship was a bill.
It does not make sense when the product is a set of decisions made on someone else’s asset, on their behalf, thousands of times a day, in markets they cannot watch. In that model the interface isn’t the last mile. It’s the entire visible surface of the value being created, and whoever owns that surface owns the customer relationship.
Our practical recommendation to anyone building in this space is unglamorous: give the portal a product owner and a roadmap rather than a project code and an end date. Design the vocabulary before the screens. Model severity commercially. Make settlement reconcilable by construction. And decide deliberately, at the outset, exactly where the line between transparency and confidentiality falls, because that line, more than any visual decision, determines whether the thing you ship reads as control or as a black box with a nicer font.
Format-3 is a design and development studio working on complex data products in energy, finance and infrastructure. If you’re building a flexibility platform, an asset owner portal, or a trading interface and want to talk about any of the above, we’d be glad to hear from you. Schedule a call today.
Sources
- Format-3, Alpiq Battery Customer Portal case study
- IEA, Electricity 2026: Flexibility
- IEA, Battery storage is scaling up and taking on a larger system role
- Alpiq, Battery energy storage systems
- Alpiq, Strategic focus on flexibility: Alpiq acquires a 125 MW BESS
- Alpiq, 370 MW BESS pipeline secured in Germany

More thoughts
Thought leadership creates value, builds knowledge and takes a stand, bridging the gap between traditional and digital platforms

Agent-first brands: Adapting for AI-driven discovery
Discover how agent-first brand strategy is reshaping discovery in technology, healthcare, and entertainment as AI agents become the gatekeepers of purchase decisions.

Driving Growth with Attention, Transparency, and Friction
Discover how our approach helps the team thrive and deliver impactful work.
SayHello!
- 17:52:15NashvilleUSA
- 18:52:15New YorkUSA
- 23:52:15LondonUK
- 00:52:15KatowicePoland
- 00:52:15BratislavaSlovakia
- 01:52:15PlovdivBulgaria
- 02:52:15DubaiUAE